
Don't build the webhook delivery table. Install it.
A customer asks whether their webhook went out, and two weeks later you are speccing a deliveries page. Repost publishes that page as a shadcn registry.
 Quentin Mousset4 min read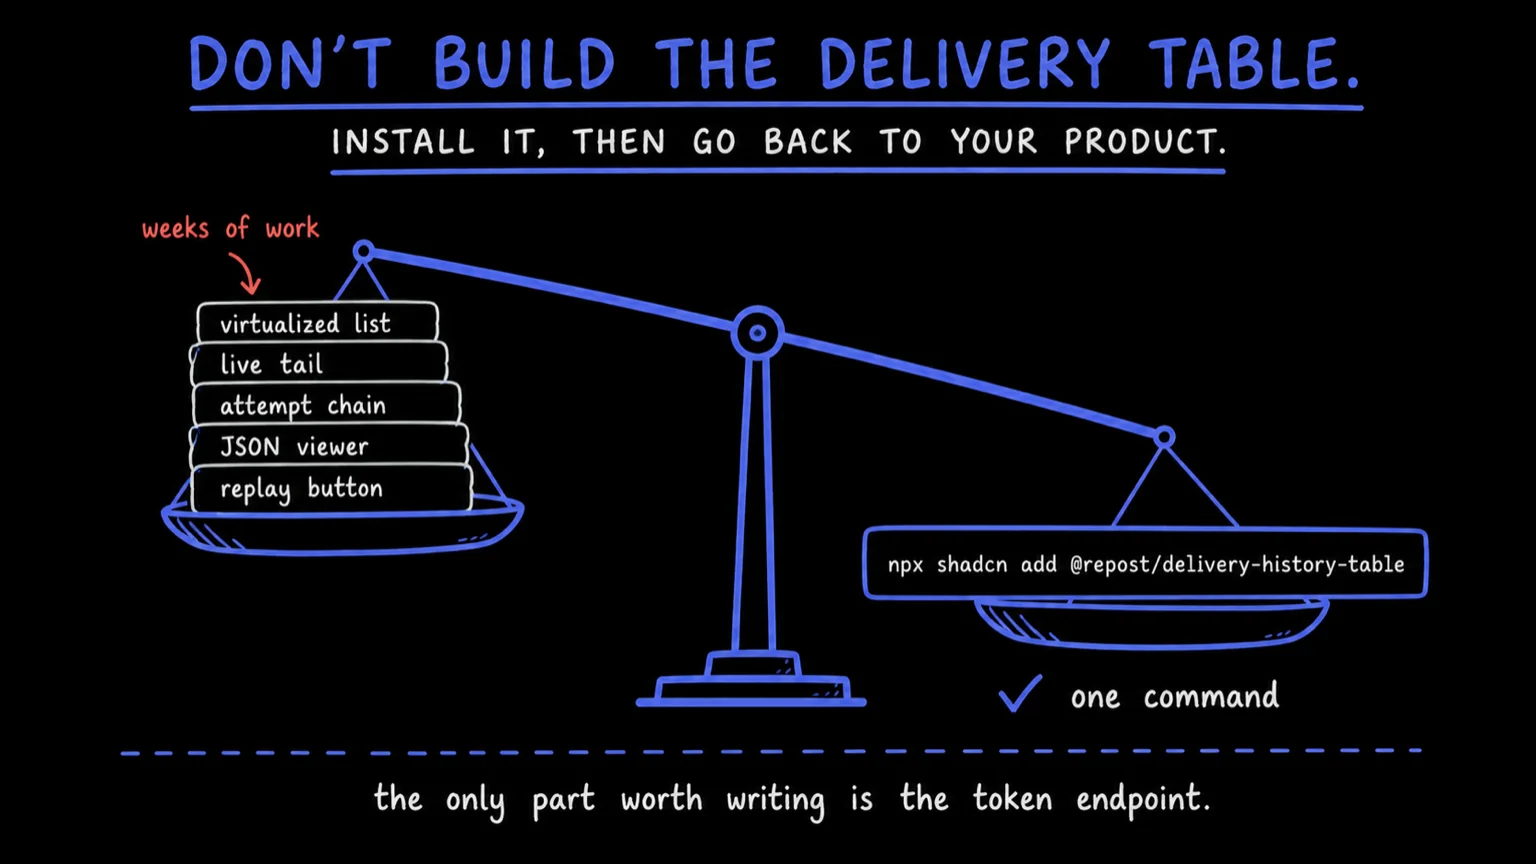
A customer asks whether their webhook went out. You look it up, you answer, it takes four minutes. Then it happens every week, so you start speccing a deliveries page in your own dashboard: history, status, attempts, the request body, a replay button. That page is real work, and it is not your product.
Three questions fill that inbox, and they never change. Did you send it. What was in it. Can you send it again. Answering them for the customer instead of for yourself is a product surface, and you are about to build it.
Sketch it and it looks like a table. Build it and it stops being one. The list is thousands of rows a customer wants to scroll, so it is virtualized or it is janky. New deliveries land while they read, so it needs a live tail that doesn't yank the viewport out from under them. A row opens into a delivery, which is a chain of attempts, each with a status, a latency, request headers, a request body, response headers, a response body. The bodies are JSON, so now you are picking a viewer. Exhausted deliveries need somewhere to go, and somebody has to press replay.
None of it is hard. All of it is weeks. And the screen you get at the end is one your customers judge you on, sitting next to the screens you actually sell.
Install the table#
Everything the Repost portal shows is published as a shadcn registry: delivery
history, the histogram, endpoint management, the dead-letter queue, the event
catalog. Register the @repost namespace once in your components.json.
{
  "registries": {
    "@repost": "https://repost.sh/r/{name}.json"
  }
}Then add a component the way you add any other.
The CLI copies the source into your project and resolves what it stands on: the virtualized table underneath, the badges, the npm packages those need, and the color tokens for delivery status, injected into your CSS with a light and a dark value each (Installation).
What lands is a file in your repo. DeliveryHistoryTable renders one row per
attempt with time, event type, endpoint, status and latency. Its className is
where you size the frame, because the table scrolls inside itself rather than
making the page scroll on its behalf. It arrives inverted, the way the portal
shows it: newest delivery at the visual bottom, scrollback loading upward. Wire
onToggleStream and the bottom strip becomes a live tail, Ctrl+Space included
(every prop).
Where the rows come from#
Nowhere, until you say. Nothing fetches inside the component: it renders what you pass it and calls back when someone clicks. The data is a separate decision, and that is the line to keep straight.
| Level | You get | You write |
|---|---|---|
| Blocks | A working dashboard view per install, wired to live data. | A getToken callback. |
| Components | Presentational pieces you feed with props. | The data wiring, via the hooks. |
| Libraries | Typed hooks and a framework-agnostic client. | All of the UI. |
@repost/portal-react is the other half: hooks over
one customer's webhook data, with a cache of its own, so an existing TanStack
Query setup in your app is left alone.
import { RepostPortalProvider, useLogsFeed } from "@repost/portal-react"
import { DeliveryHistoryTable } from "@/components/delivery-history-table"

export function Deliveries() {
  return (
    <RepostPortalProvider getToken={getToken}>
      <DeliveryList />
    </RepostPortalProvider>
  )
}

function DeliveryList() {
  const feed = useLogsFeed()

  return <DeliveryHistoryTable className="h-[420px]" rows={feed.rows} />
}useLogsFeed runs a websocket on top of a REST backfill: deduped, newest
first, with a buffer cap and a counter for the rows the stream dropped. There
is no polling anywhere in the library.
The one part you write yourself#
The browser never sees your API key. Your backend mints a portal access token for the customer who is signed in, and hands that over instead.
const url = "https://api.repost.sh/v1/customers/" + customerId + "/portal-access"

const response = await fetch(url, {
  method: "POST",
  headers: { Authorization: "Bearer " + process.env.REPOST_TOKEN },
})

const { token } = await response.json()getToken is a callback returning that token, and every wired piece takes one
and handles refresh itself. Tokens are short-lived and scoped to one customer
in one environment, so mint one per request and store none.
Mint it with readOnly: true and the whole surface still reads, live feed
included, while every mutation comes back 403 forbidden. That is the support
view your own team asks for the week after the customer view ships.
usePortalContext exposes the flag, so the buttons can be gone before anyone
gets to click one.
The drawer is where the weeks go#
The table is the easy half. The hard half is what opens when a customer clicks
a row, and delivery-detail is the drawer
the Repost app itself opens, ported whole.
RowDetailSheet is the sheet around it: right-hand, and deliberately not
modal, so clicking another row swaps the detail in place instead of closing on
you. Inside, the delivery's current state sits on top, the attempt trail
underneath as a selectable table, and the request and response of the selected
attempt below that, each with a headers and body toggle.
Those inspectors are Monaco in read-only mode, following your light and dark
themes. ISO timestamps pick up a readable annotation inline. Hovering a line
offers copy, plus include and exclude callbacks a query bar of yours can
consume. A string body renders in whatever language the Content-Type
resolves to.
Pass onReplay and the Replay action appears. Leave it out and it doesn't,
which is how a read-only view stays read-only. If you want the attempt trail
without the drawer around it,
delivery-attempts-panel is that
half alone, and its entire prop surface is attempts and isLoading.
The rest of the support queue#
dlq-panel: dead-lettered deliveries, one replay button per row.endpoints-listandendpoint-form: endpoints with status and dead-letter counts, plus edit, pause, resume, delete, and reveal the signing secret. Leave a callback out and its button is never rendered.event-catalog-browser: your published event types, grouped, with sample payloads generated from their schemas, the same ones your SDKs come from.webhook-metrics-cardsandtimeline-histogram: volume, success rate and failures, each with a sparkline, above a timeline stacked by status that you drag across to select a range.
The catalog has a live preview and a props table per
component. And if you would rather not assemble a view at all, install a whole
one: @repost/webhook-dashboard composes the metrics, the timeline, the
history table and the drawer, already wired.
Webhooks
Paused@repost/endpoint-management,
@repost/webhook-dlq and @repost/event-catalog do the same for the other
three surfaces. Each one takes getToken and works.
It is your code the moment it lands#
Styling is standard shadcn tokens plus four status tokens
(--status-success, --status-error, --status-warning, --status-info)
the CLI injects with light and dark values. Override those and the whole set
rebrands at once. Anything structural, you edit, because it is your file now:
reorder the block's sections, drop the histogram, wrap the table in your own
card.
Your customers will judge that page, and not one of them will ask who wrote it. The only part worth writing yourself is the token endpoint.